US Map with Major Cities
This map plots the 50 most populous cities in the United States, with each dot sized by its 2020 Census population. Hover or tap a city to see its population and rank.
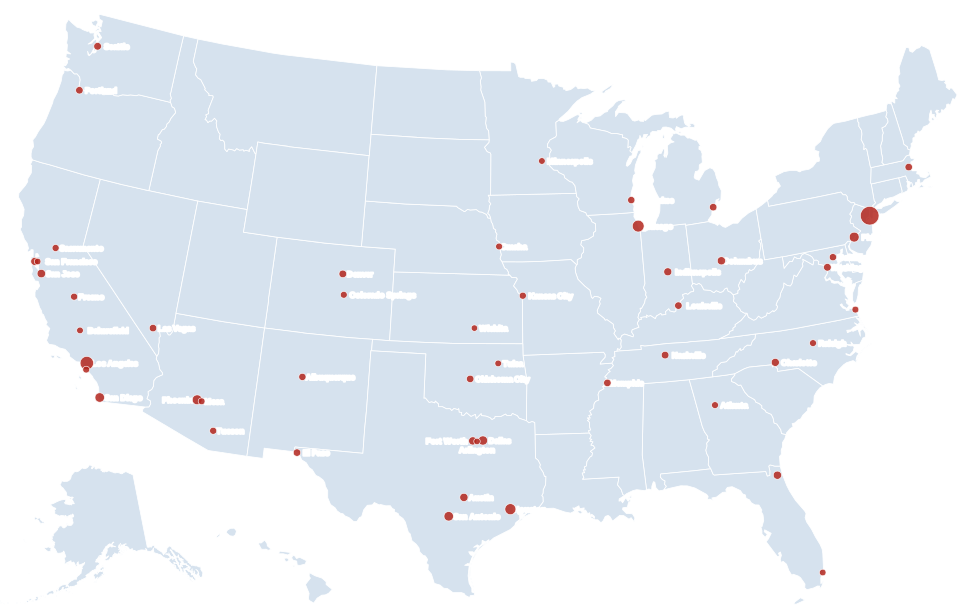
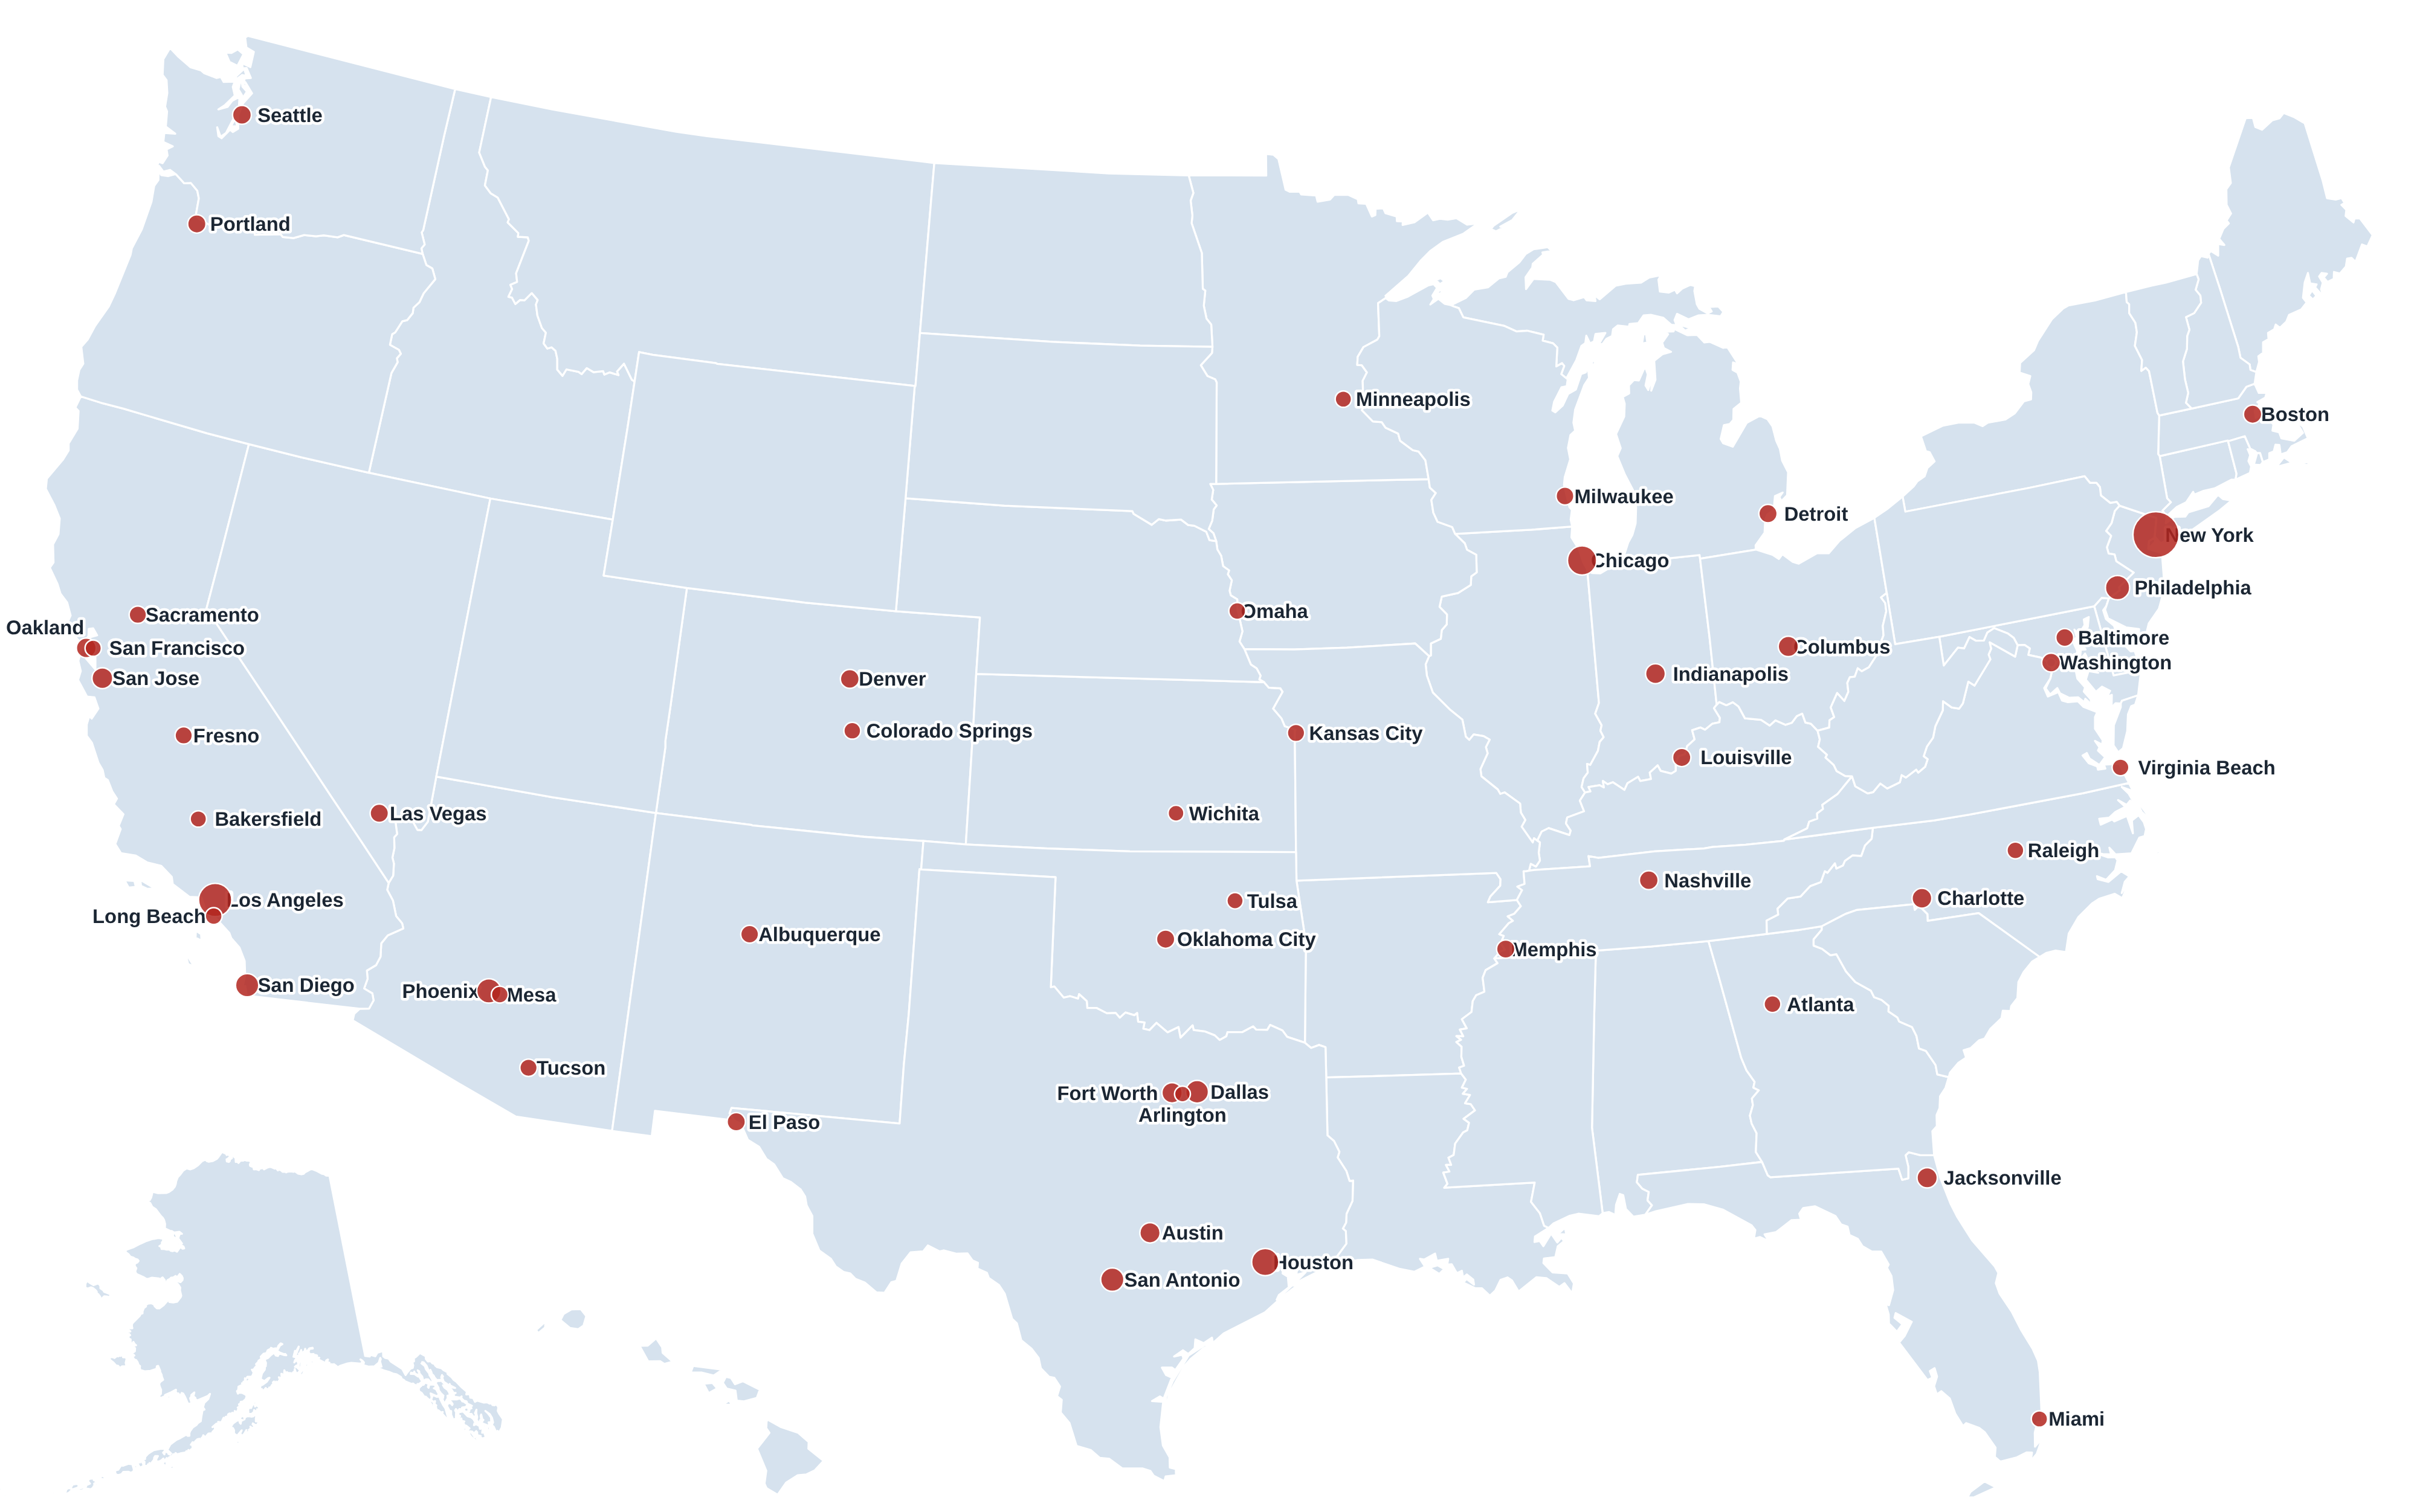
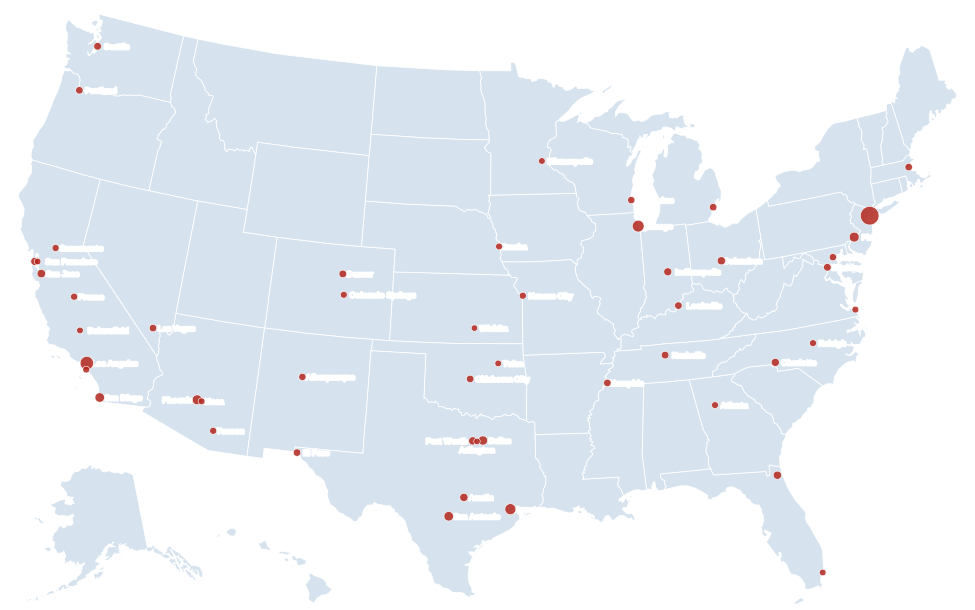
The 50 largest cities in the US
Populations are for the city proper (inside city limits) from the 2020 Census, not the wider metro area.
| Rank | City | State | Population (2020) |
|---|---|---|---|
| 1 | New York | New York | 8,804,190 |
| 2 | Los Angeles | California | 3,898,747 |
| 3 | Chicago | Illinois | 2,746,388 |
| 4 | Houston | Texas | 2,304,580 |
| 5 | Phoenix | Arizona | 1,608,139 |
| 6 | Philadelphia | Pennsylvania | 1,603,797 |
| 7 | San Antonio | Texas | 1,434,625 |
| 8 | San Diego | California | 1,386,932 |
| 9 | Dallas | Texas | 1,304,379 |
| 10 | San Jose | California | 1,013,240 |
| 11 | Austin | Texas | 961,855 |
| 12 | Jacksonville | Florida | 949,611 |
| 13 | Fort Worth | Texas | 918,915 |
| 14 | Columbus | Ohio | 905,748 |
| 15 | Indianapolis | Indiana | 887,642 |
| 16 | Charlotte | North Carolina | 874,579 |
| 17 | San Francisco | California | 873,965 |
| 18 | Seattle | Washington | 737,015 |
| 19 | Denver | Colorado | 715,522 |
| 20 | Washington | District of Columbia | 689,545 |
| 21 | Nashville | Tennessee | 689,447 |
| 22 | Oklahoma City | Oklahoma | 681,054 |
| 23 | El Paso | Texas | 678,815 |
| 24 | Boston | Massachusetts | 675,647 |
| 25 | Portland | Oregon | 652,503 |
| 26 | Las Vegas | Nevada | 641,903 |
| 27 | Detroit | Michigan | 639,111 |
| 28 | Memphis | Tennessee | 633,104 |
| 29 | Louisville | Kentucky | 633,045 |
| 30 | Baltimore | Maryland | 585,708 |
| 31 | Milwaukee | Wisconsin | 577,222 |
| 32 | Albuquerque | New Mexico | 564,559 |
| 33 | Tucson | Arizona | 542,629 |
| 34 | Fresno | California | 542,107 |
| 35 | Sacramento | California | 524,943 |
| 36 | Kansas City | Missouri | 508,090 |
| 37 | Mesa | Arizona | 504,258 |
| 38 | Atlanta | Georgia | 498,715 |
| 39 | Omaha | Nebraska | 486,051 |
| 40 | Colorado Springs | Colorado | 478,961 |
| 41 | Raleigh | North Carolina | 467,665 |
| 42 | Long Beach | California | 466,742 |
| 43 | Virginia Beach | Virginia | 459,470 |
| 44 | Miami | Florida | 442,241 |
| 45 | Oakland | California | 440,646 |
| 46 | Minneapolis | Minnesota | 429,954 |
| 47 | Tulsa | Oklahoma | 413,066 |
| 48 | Bakersfield | California | 403,455 |
| 49 | Wichita | Kansas | 397,532 |
| 50 | Arlington | Texas | 394,266 |
What the cities map shows
- 10 cities had more than one million residents in 2020: New York, Los Angeles, Chicago, Houston, Phoenix, Philadelphia, San Antonio, San Diego, Dallas, San Jose.
- California has 9 of the top 50, followed by Texas with 7 and Arizona with 3.
- The Sun Belt dominates: most top-50 cities lie in the South and West, where cities annexed suburbs as they grew. Older Northeast and Midwest cities have tight boundaries, so their city populations look small next to their metro areas.
- The Texas Triangle: Houston, San Antonio, Dallas, Austin, Fort Worth and Arlington, all linked by I-35, I-45 and I-10, make up six of the top 50.
- Capital vs. largest city: most state capitals are not their state’s biggest city. Compare them on the US map with capitals.
City vs. metro area
Rankings change depending on what you measure. Jacksonville ranks 12th by city population because the city merged with its county in 1968, while Atlanta ranks 38th even though its metro area is one of the ten largest in the country. When comparing places for moving, business or travel, metro-area figures (metropolitan statistical areas) usually reflect the real size of a city better than city-limit counts.
Frequently asked questions
What is the largest city in the US?
New York City, with 8,804,190 residents in 2020, more than twice the population of second-place Los Angeles.
Which cities appear on the map?
The 50 most populous incorporated cities from the 2020 Census, plus their state. Washington, D.C., is included at rank 20.
Are there maps of cities within each state?
Yes. Each state page has a zoomable map with that state’s major cities and county lines.